


- Delta
- Máy tính công nghiệp/ Phần mềm
- Phần Mềm
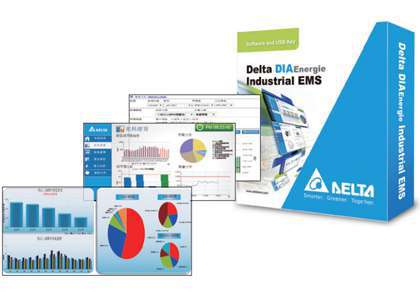
- Industrial EMS
- DIAE-0102000

DIAE-0102000
| Giá sản phẩm: |
|
| Tình trạng sản phẩm: | Còn hàng |
Knowing that the greatest share of power consumption is due to manufacturing industries in most countries, Delta presents the DIAEnergie Industrial Energy Management System to help our customers achieve real-time monitoring of the power consumption in their factories.
The DIAEnergie system is able to collect and analyze power usage data from different facilities in real-time, and present detailed and easy-to-read real-time or historical energy information for users or managers. It also sends warning messages to managers when abnormalities occur to achieve highly-efficient operation and management. With decades of experience in the industrial automation industry, Delta understands customer needs for realtime energy monitoring and analysis. DIAEnergie is an excellent tool for power efficiency enhancement on equipment and production lines, as well as building a better energy strategies for users.
DIAEnegie features:
• Real-time Energy Management
• Energy Dashboard
• Energy Diagnosis, and Analysis Visualization
• Energy Performance Monitoring and Analytics
• Reports and Alarms
• Modbus and OPC Client Communication


Energy Management
Determine and Diagnose Current Conditions
■ Analysis of energy performance indicators (EnPI)
■ Analysis of energy saving performance
Identify Problems and Opportunities
■ Ranking of energy consumption
■ Analysis of energy consumption structure
■ Electricity cost analysis
■ Demand analysis
Select and Devise Solutions
■ Establish EnPI
■ Establish Energy Baseline (EB)
Implement Solutions and Obtain Feedback
■ Instant energy consumption and load characteristics analysis
■ Analysis of energy consumption differentiation
■ EnPI monitoring
■ Reports of energy consumption data
■ Alarms

Benefits
■ Reduces energy cost
■ Power usage monitoring and visualization, and abnormality detection to find more possiblities for energy savings
■ Monitors equipment power efficiency and expands their service time
■ Discovers reactive and excessive power consumption to avoid electricity fines
■ Provides reports on energy saving and efficiency comparison for reference
Functions
■ Provides measurement data analysis from various perspectives (areas, power circuits and time periods)
■ Offers a variety of graphs and charts to view and analyze data quickly
■ Monitors energy performance indicators of equipment
■ Monitors power quality parameters
■ Sends out alarms and fault messages
Features of DIAEnergie
Energy Dashboard
The energy dashboard displays significant power consumption in graphical visualization, such as alarms and more, allowing users to quickly and intuitively monitor real-time power usage conditions

■ Easy settings to quickly build an energy dashboard
■ Abundant statistical diagram tools
■ Various analysis and display tools allow highly flexible usage and customization for an energy monitoring interface
■ Allows background image and animation input to enrich the energy dashboard
■ Auto-play function
Energy Intensity
Performs correlation analysis for production and power usage to ensure efficient electricity consumption, to achieve a balance between energy-saving and production

Alarms
Performs contrast analysis with the previous energy consumption to show the trends for each piece of energy-consuming equipment

Trends
Displays each section's overall energy consumption trend to determine correct energy-saving strategies

Notes
Flexibly edits log contents for convenient job descriptions and information transmission

Energy Diagnosis, Visualization and Analysis
DIAEnergie provides a rich variety of charts to view energy consumption from various perspectives. It helps users realize changes in excessive energy consumption, and finds areas for energy savings.
Analysis of regional energy consumption
■ Offers analysis view of energy consumption and power usage by equipment / area / region
■ System diagnosis for abnormal power consumption or other issues

Ranking of energy consumption
■ Detects excessive energy consumption
■ Identifies significant power consuming equipment

Analysis of energy consumption by different time periods
■ Monitors how the power consumption of the lighting system changes during lunch breaks ■ Verifies if the energy control strategy works for different time periods

DIAEnergie collects data from different circuits, sub systems, equipment and meters to monitor various areas of energy consumption, such as electricity, water, fuel, gas and others, and generates easy-toread reports and displays for comprehensive energy visualization, comparison and analysis.
■ Comparison with the performance / increase or decrease / statistics on a month-on-month (MoM), and year-on-year (YoY) basis by energy type (electricity, water, fuel, gas and others), and by circuit / system / equipment
■ Contrast analysis of previous and current period of average energy consumption
■ Contrast analysis of changes in energy consumption and key power factors such as outside air temperature, production output, working hours and others
MoM and YoY analysis by circuit, by sub system, by equipment and by energy type

Contrast analysis of previous and current period of average energy consumption

Contrast analysis of energy consumption and key power factors

Energy Performance Monitoring and Analytics
DIAEnergie allows self-defined power efficiency indices for key facilities and production processes and compares them with the indices of governmental policy, helping users to achieve energy savings.
■ Equipment electricity categorization
■ Real-time power output
■ Accumulated energy consumption
■ Energy consumption contrast analysis
■ Capital and carbon emission
Production rate of different shifts reflects production efficiency

Energy Use Intensity (EUI) (based on user's demands)
Reduces power consumption of each product to save energy cost

Load factors of transformers
The transformer consumes more energy in operation at lower loads

Energy Performance Analytics
Through regression analysis, DIAEnergie establishes an Energy Baseline (EB) and builds a statistical model with Energy Performance Indicators (EnPI) and affected factors, such as outdoor weather and Coefficient of Performance (COP). It to intuitively presents energy efficiency enhancement and is the ideal database and reference for energy management.

Electricity Management with Time of Use Rates
Calculates electricity costs according to electricity rates by time of day, and makes adjustments to electricity usage at peak time while reducing cost.
■ Electricity tariff analysis
■ Electricity usage calculation at different times of day
■ Electricity cost calculation for different times of day

Reports
■ User-defined reports
■ Generates daily, weekly, monthly, quarterly and yearly reports
■ Manually generates data reports
■ Automatically sends reports by e-mail

Alarms
■ Maximum electricity demand
■ Current capacity and energy consumption limitations
■ Communication errors
■ Highlights pending alarms and alarm types
■ Alarm notification by e-mail to relevant operators
Standard Modbus Communication
Flexibly and quickly integrates various devices and equipment of other brands into DIAEnergie System via Modbus communication.

OPC Client
OPC Client protocol for easier communication and integration with third-party equipment and SCADA Systems.
Virtual Grouping Function
The virtual grouping function allows the system to categorize data from third-party devices such as PLC and the SCADA System, building a simpler and more transparent system structure.

Yêu cầu báo giá
Xem thêm ▼
CUSTOMERS COMMENT
5
0%
4
0%
3
0%
2
0%
1
0%
Gửi nhận xét của bạn
Sản phẩm liên quan


Delta
-
Điều khiển động cơ AC
-
Biến tần
-
-
BIẾN TẦN NHỎ GỌN
-
-
-
BIẾN TẦN TIÊU CHUẨN
-
-
-
BIẾN TẦN NGÀNH NHỰA
-
-
-
BIẾN TẦN NGÀNH QUẠT VÀ BƠM
-
-
-
BIẾN TẦN ĐIỀU KHIỂN THANG MÁY & CỬA
-
-
-
BIẾN TẦN NGÀNH DỆT
-
-
-
Quản lý chất lượng điện năng
-
-
QUẢN LÝ CHẤT LƯỢNG ĐIỆN NĂNG
-
-
-
Biến tần
-
Điều khiển truyền động công nghiệp
-
Động Cơ Servo và Bộ điều khiển
-
-
DÒNG SERVO TIÊU CHUẨN
-
-
Bộ điều khiển CNC
-
-
Giải pháp cho máy CNC
-
-
-
Bộ Điều Khiển Chuyển Động (PAC)
-
-
Điều Khiển Truyền Động Trên PC (PAC)
-
-
-
ĐIỀU KHIỂN TRUYỀN ĐỘNG DMCNET
-
-
-
ĐIỀU KHIỂN TRUYỀN ĐỘNG ETHERCAT
-
-
-
CODESYS SoftPLC Platform
-
-
- Hộp Số Servo
-
Động Cơ Servo và Bộ điều khiển
-
Hệ thống điều khiển giám sát
-
Bộ điều khiển lập trình PLC
-
-
AH Series
-
-
-
AS Series
-
-
-
DVP Series Standard
-
-
-
DVP Series Slim CPU
-
-
-
DVP Series Motion CPU
-
-
-
Màn hình cảm ứng (HMI)
-
-
DOP-100 Series
-
-
-
DOP-W Series
-
-
-
DOP-H Series
-
-
-
TP Series
-
-
-
DOP-B Series
-
-
- Màn Hình Text
-
Màn Hình Giao Diện Cảm Ứng HMI Tích Hợp PLC
-
-
TP-Series
-
-
-
Bộ điều khiển lập trình PLC
-
Cảm biến/ Hệ thống điều khiển giám sát tiến trình/ Thiết bị trường
-
Đồng hồ đo nhiệt độ
-
-
DT Series
-
-
-
Máy ép điện servo
-
-
Loại Unit
-
-
-
Loại Standard
-
-
-
Hệ thống thị giác máy Machine Vision
-
-
DMV1000 Series
-
-
-
DMV2000 Series
-
-
-
DMV3000G Series
-
-
-
Máy quét mã vạch Barcode
-
-
Handheld Types
-
-
-
Fixed-mount Types
-
-
-
Cảm biến thị giác máy
-
-
VIS Series
-
-
-
Đồng hồ đo điện năng
-
-
DPM Series
-
-
-
Cảm biến
-
-
Sensor Quang
-
-
-
Cảm biến tiệm cận
-
-
-
Cảm biến khoảng cách laser
-
-
-
Cảm biến vùng
-
-
- Bộ đếm xung Encoder
-
Cảm biến áp suất
-
-
DPA
-
-
-
DPB
-
-
-
Timer/Counter/Tachometer/Điều khiển van
-
-
CTA
-
-
-
Đồng hồ đo lưu lượng khí
-
-
DFM
-
-
-
Đồng hồ đo nhiệt độ
-
Nguồn công nghiệp
- Bộ Nguồn DIN-RAIL
-
Bộ Nguồn Tổ Ong
-
-
Bộ nguồn tổ ong
-
-
-
Bộ nguồn hở
-
-
Bộ nguồn hở
-
-
-
Mạng công nghiệp
-
Mạng truyền thông công nghiệp Ethernet
-
-
Unmanage Switch
-
-
Mạng truyền thông công nghiệp Fieldbus
-
-
Industrial Network Converter
-
-
-
Master Module
-
-
-
Slave Module
-
-
-
USB Converter
-
-
-
Modbus Serial Converter
-
-
-
Remote I/O Communication Module
-
-
-
Mạng truyền thông công nghiệp Ethernet
-
Máy tính công nghiệp/ Phần mềm
-
Máy tính PC công nghiệp
-
-
Industrial PC
-
-
-
Panel PC
-
-
-
Phần Mềm
-
-
IIoT Solution
-
-
-
Factory
-
-
-
Máy tính PC công nghiệp
-
Robot công nghiệp
- SCARA Robot
-
Articulated Robot
-
-
Delta Articulated Robot
-
-
-
Bộ Điều Khiển Robot
-
-
Robot Controller
-
-
-
Màn hình điều khiển Robot
-
-
Handheld Teaching Pendant
-
- Năng lượng tái tạo

Trụ sở - Etec HCM
Kết nối


Chi nhánh - Etec Hà Nội
Copyright 2021 by Etec. All rights reserved.

Yêu cầu báo giá